
By Matthieu Eynard Longuet

The phone rings. The VMware team is seeing alerts on vCenters: datastores absent, datastores unresponsive. Within minutes, our storage team forms a small taskforce. Three engineers, one incident, one shared question: what is going on?
On paper, everything was “monitored.” The arrays were under supervision. The SAN fabric was instrumented. vCenter was reporting. But before we could do anything useful, we had to spend the next 30 to 45 minutes figuring out what we were actually looking at.
That gap, between being alerted and understanding what is happening, is what this article is about.
Twelve Volumes, Eleven Seconds of Latency
Once we cornered the symptoms, the picture was stark: 12 LDEVs in GAD (Global Active Device), our active-active synchronous replication setup between two storage arrays, showing 3,500ms of latency on the secondary side and 11,000ms on the primary.

For context, a healthy block workload operates below 1ms.
Several of those volumes carried core banking trading workloads.
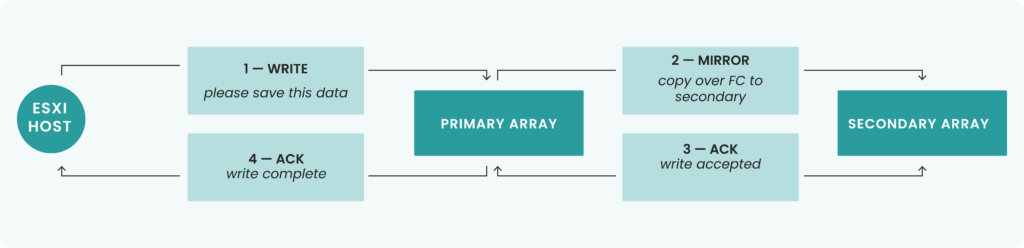
In synchronous replication, step 4 cannot happen until step 3 does. The primary only tells the host “done” once the secondary has confirmed. When the secondary backend stalls, every write in flight waits, cache slots on the primary stay locked, and the delay propagates back to the host. This view is simplified, but the principle holds: synchronous replication binds two arrays together, and the host feels the weakest link.
Nothing about these numbers is subtle. And yet, identifying the exact scope (what was affected, what was not, what sat between the two) took us the first act of the incident. We had alerts. We just did not have the right alerts, in the right shape, at the right time.
Three Engineers Running in Parallel
With the scope established, we split the investigation.
GAD latency issues typically come from the inter-site replication path itself. The two arrays are linked over dedicated Fibre Channel, so the usual suspects are link health, port errors, path degradation, or fabric contention. We checked. Clean.
Maybe a single host was saturating shared FC ports and dragging latency across volumes. We checked. The affected LDEVs were spread across different ports. Clean.
Then we came back to an older hypothesis. A disk had been replaced earlier on the secondary array, and something about that replacement was stalling the backend. Under normal conditions, a disk swap should never produce latency of this magnitude. None of us had ever seen that. But it was the only plausible vector left. To understand why a stalled backend on the secondary array ends up inflicting eleven seconds of latency on the primary, it helps to picture how a synchronous write actually travels:
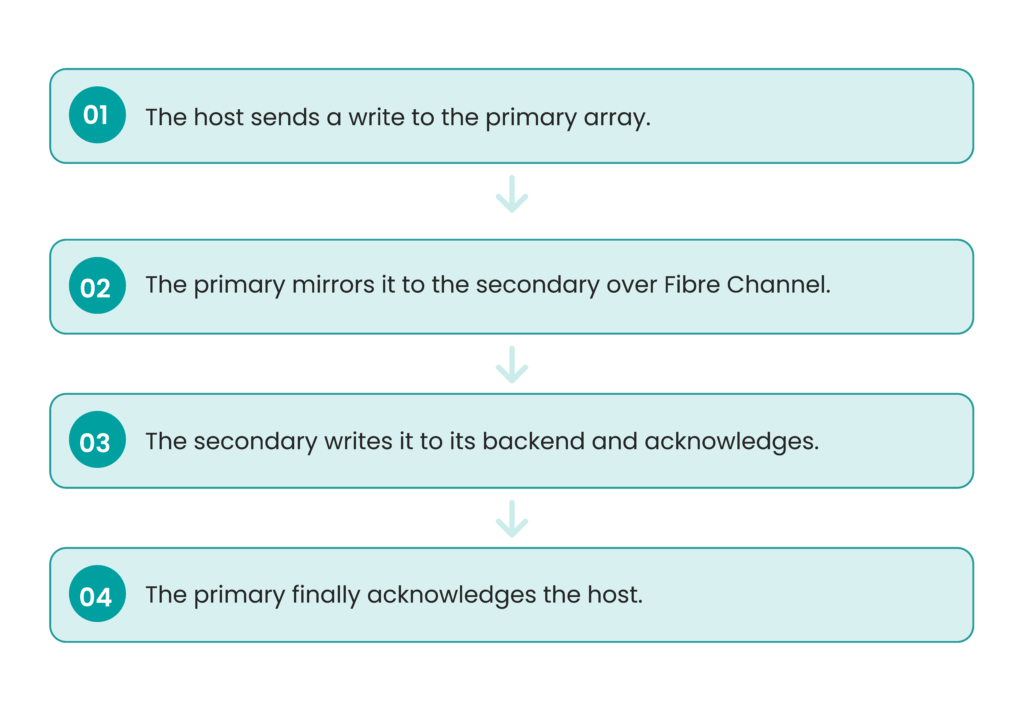
In normal operation, this round trip is measured in hundreds of microseconds or some milliseconds at most. When the secondary backend stalls, every write in flight waits. And because the primary may not be able to free cache or complete its own destage pipeline until those acks come back, pressure accumulates. A 3,500ms backend delay on the secondary translates to a much longer effective latency on the primary, which is exactly what we observed.
We cut the GAD synchronous mirror on the affected volumes. Latency dropped back to normal almost immediately, giving the backend time to clear the situation and begin reconstruction cleanly.
Total time to mitigation: roughly one hour and a half. Time that would have been significantly shorter if the correlation had been presented to us, instead of us having to assemble it ourselves.
The Alerts We Were Missing
This is where observability stops being a technology conversation and becomes a design conversation.
We were not short on data. We had metrics. We had dashboards. What we did not have was correlated signal.
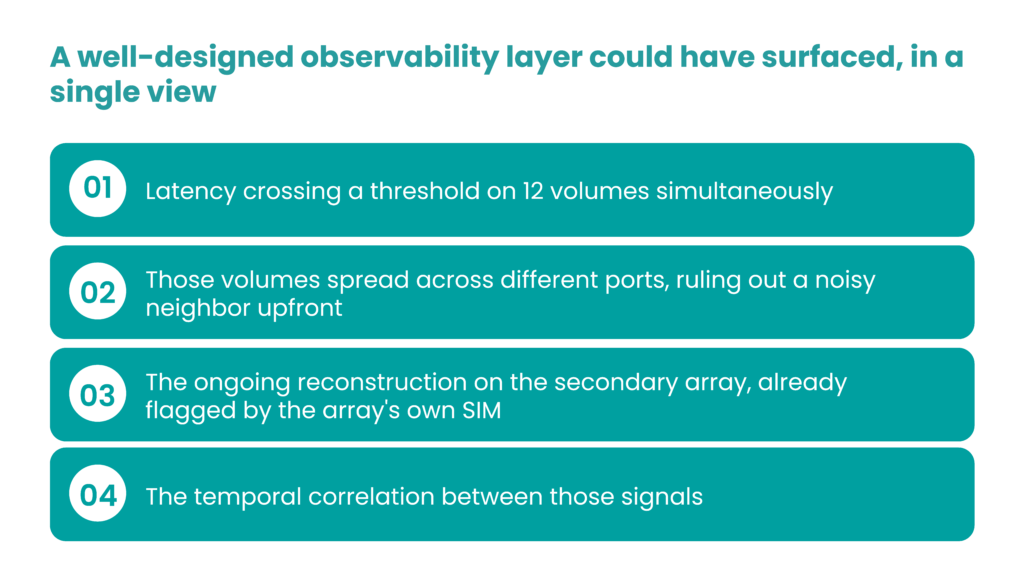
Put together, that is the incident narrative. A human still makes the final call. But the human starts the decision-making process with context, not with questions.
Instead, we reconstructed that narrative in a war room.
Logs Are Not Information
It is easy to confuse having telemetry with having visibility. They are not the same thing.
Having metrics is not alerting. Having dashboards is not alerting either. Without correlation between signals, without cross-checks between subsystems, metrics stay decorative. They sit there, visible, but they do not tell you anything you did not already have to go looking for.
A system that emits thousands of events per second can still be opaque. The question is never “am I collecting data?” The question is “can I answer, right now, what is happening, in a way that leads to a decision?” Recent industry data makes this uncomfortable to ignore.
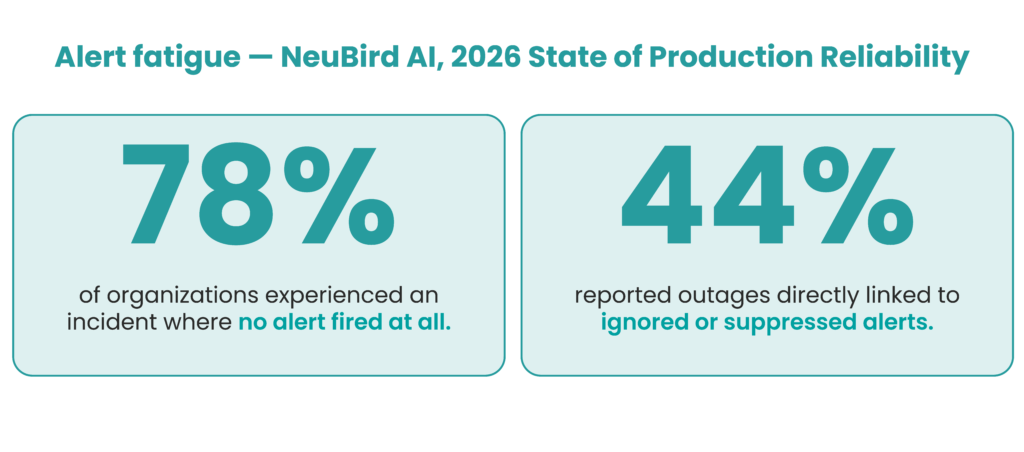
The trap is twofold. Too many alerts, and humans stop reading them. Too few, and they feel safe when they should not. The real discipline is calibration. And calibration does not come from buying tools. It comes from knowing your workload, your failure modes, and your humans.
What the Homelab Reinforced
In my homelab i run:
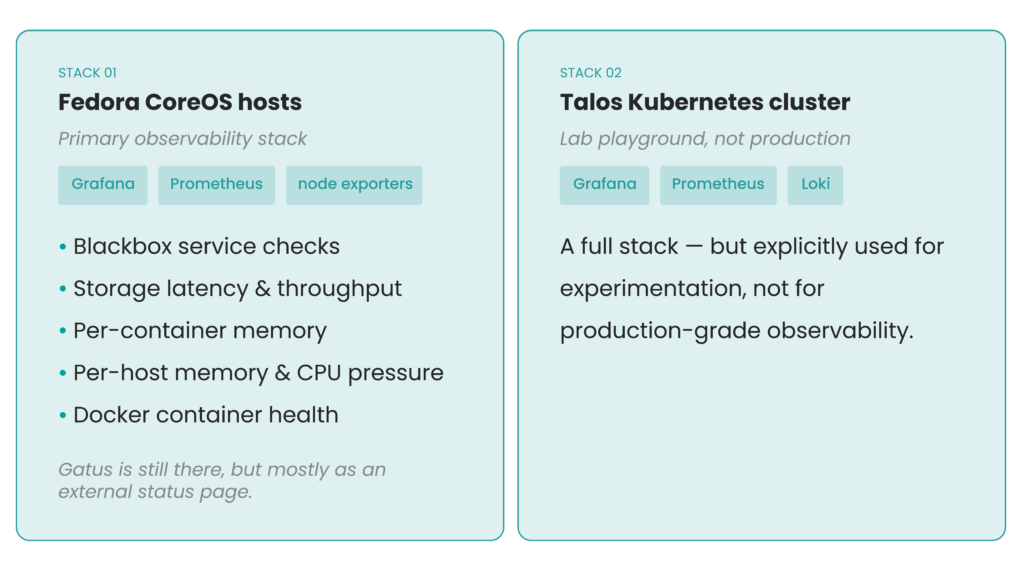
What this setup has taught me is simple. Operating alone, with no escalation chain, forces you to be brutally honest about what matters. You cannot afford false positives, because you are the one answering the notification. You cannot afford blind spots either, because there is no one else to catch what you missed. Every alert has to justify its existence.
Even so, I am certain I still have blind spots I have not yet discovered. That is always the case.
Enterprise environments have more tools, bigger teams, deeper safety nets. But the underlying discipline is the same. Signal has to mean something.
Observability Is a Posture
The most important thing about observability is that it is not a feature you add.
It is a posture you build.
Built before the incident, not during it. Built alongside the architecture of the service, not bolted on afterward.
A team without observability discipline does not suddenly gain clarity at 3am. They inherit whatever they prepared beforehand. If alerts were not calibrated, if correlations were not in place, if the context was not pre-assembled, the team still reacts, still investigates, still resolves. But slower. Under more stress. With more risk.
And in environments where some of the volumes are core banking trading, time and risk are not abstract costs.
The Humans Behind the Screen
Strictly speaking, observability is about machines. They produce the signals, they emit the logs, they run the dashboards. But that framing misses what observability is actually for.
It is for the humans who have to decide, under pressure, with incomplete information, what to do in the next five minutes.
Tooling that does not respect that reality, tooling that floods its operators with noise, tooling that forces its users to rebuild meaning from scratch at 11:47 on a Tuesday, is not observability. It is telemetry with a dashboard on top.
The systems that hold up under pressure are the ones designed around the people who operate them.
What Is Next
Backup. Storage. Observability. Three articles, three layers of the same conversation: infrastructure is not what you deploy. It is what survives contact with reality.
There is more to write about. About automation. About runbooks. About the teams who carry this work every day, invisible until something breaks.
For now, the takeaway is simple.
If you are measuring your observability by the number of dashboards you have, you are measuring the wrong thing.
Ask instead: when the next incident happens, how many minutes will your team spend understanding what is happening, before they can start deciding what to do?
That is one of your real observability metric.

References
NeuBird AI. (2026, April 6). 2026 State of Production Reliability and AI Adoption Report. Retrieved April 21, 2026, from https://www.businesswire.com/news/home/20260406439955/en/
Atlassian. (n.d.). Understanding and fighting alert fatigue. Retrieved April 21, 2026, from https://www.atlassian.com/incident-management/on-call/alert-fatigue
About the Author

Matthieu Eynard Longuet is Storage Engineer (Architecture & DevOps) at Ivy Partners. He is currently designing and operating mission‑critical storage and backup platforms for a leading global private bank.
With a foundation in software and game development, as well as extensive hands‑on homelab experimentation, Matthieu brings a builder’s mindset and an open‑source ethos to enterprise infrastructure. He combines robust hardware with modern automation to deliver resilience, performance, and reliability across complex, multi‑datacenter environments.
Bridging architecture and engineering, he applies DevOps and reliability practices to high‑stakes systems while continuously learning, experimenting, and sharing knowledge. From virtual worlds to petabyte‑scale banking platforms, his focus remains constant: stability, optimization, and building things the right way.